


Proton nuclear magnetic resonance spectroscopy of biofluids has become one of the key techniques for metabolic profiling and phenotyping. This technique has been widely used in a number of epidemiological studies and in a variety of health disorders. However, its utilization in brain disorders is limited due to the blood–brain barrier, which not only protects the brain from unwanted substances in the blood, but also substantially limits the potential of finding biomarkers for neurological disorders in serum. This review article focuses on the potential of localized in vivo proton magnetic resonance spectroscopy (1H-MRS) for non-invasive neurochemical profiling in the human brain. First, methodological aspects of 1H-MRS (data acquisition, processing and metabolite quantification) that are essential for reliable non-invasive neurochemical profiling are described. Second, the power of 1H-MRS-based neurochemical profiling is demonstrated using some examples of its application in neuroscience and neurology. Finally, the authors present their vision and propose necessary steps to establish 1H-MRS as a method suitable for large-scale neurochemical profiling in epidemiological research.
Key Messages
In vivo neurochemical profiling in the human brain is feasible, but the widespread use requires the implementation of the most advanced methodologies of 1H-MRS.
There is a widening gap between what is feasible at specialized MR research centres and what is currently available for routine clinical practice.
The software upgrade (B0 shimming, localization pulses sequence) on clinical 3T MR scanners is sufficient for a significant improvement of the 1H-MRS data quality and for an increase in the range of reliably quantified metabolites.
Introduction
Applications of comprehensive metabolic profiling are increasingly common in epidemiology.1,2 In general, ‘metabolic profiling’ refers to the simultaneous quantification of a wide range of low-molecular-weight metabolites in a variety of tissues or biofluids. As the fundamental principles of epidemiology require large-scale cohort studies, only minimally invasive, high-throughput screening methods are acceptable for these types of studies. Consequently, metabolic profiling has been almost exclusively applied to biofluids, such as plasma (serum) or urine, using high-resolution liquid-state 1H nuclear magnetic resonance (NMR) spectroscopy or mass spectrometry (MS) combined with chromatographic separation.1 These metabolic profiles provide a top-down ‘systems-level’ readout of the biochemistry, physiological status and environmental exposure of individuals and populations that can be exploited in personalized medicine and public healthcare.3 Wide-range metabolic phenotyping has been successfully applied to different health issues, such as nutritional problems,4 effects of long-term physical activity,5 type 1 and 2 diabetes6,7 and cardiovascular diseases.2 Other studies indicated the potential of blood plasma metabolic phenotyping as a tool to discriminate between cancer types.8 However, these types of preliminary results must be taken with caution due to the tendency of multivariate classification to overestimate the predictive power of the method when the number of subjects is small.9 Metabolic phenotyping is becoming important in disease prevention due to its potential to identify individuals or sub-populations at risk, allowing for interventions (change in lifestyle, diet or appropriate medication) before the onset of the disease.3 Metabolic phenotyping can be further utilized in personalized medicine for patient stratification by analysing pre-dose biofluid metabolite profiles to predict drug effects,10 which would increase the efficacy of treatment and decrease unwanted side effects.11,12
Metabolic phenotyping and neurological disorders
Applications of metabolite phenotyping to neurological disorders are rather sparse.13,14 The brain metabolism and its homeostasis are well protected from the rest of the body and circulating blood by the blood–brain barrier (BBB), which substantially limits the potential for finding biomarkers for neurological disorders in serum15 and even more in urine.16 For that reason, metabolic profiling of cerebrospinal fluid (CSF) should be able to characterize the neurochemical status of the central nervous system (CNS) more directly than the profiling of plasma or urine.17–19 However, the CSF sample collection by lumbar puncture is invasive and is justified only for diagnostic purposes. Such an invasive procedure is not ideal for repeated follow-up visits to assess the efficacy of treatment and cannot be applied for screening in the general population.19 Moreover, metabolic profiling of CSF has a limited capability to map regional metabolic deviations from brain homeostasis due to the high complexity of the CNS and its regional heterogeneity (e.g. cortical and subcortical structures, grey and white matter), diversity of neural cell types (neurons, glia), neuronal morphology (soma, dendrites, axons) and neuronal diversity (e.g. glutamatergic and GABAergic neurons). For these reasons, profiling techniques directly targeting the brain tissue would be preferential. Although ex vivo metabolic profiling of intact brain tissue (magic-angle-spinning NMR) or tissue extracts is a powerful tool for animal model studies,20 sample collection using brain biopsy is totally unsuitable for any type of epidemiological screening in the general population. Considering the pros and cons of previously mentioned methodologies, localized in vivo1H magnetic resonance spectroscopy (MRS) might be the method of choice for metabolic profiling and phenotyping of CNS diseases.
Does 1H-MRS meet the criteria for epidemiology screening?
In epidemiology, prerequisites for metabolomics methodologies are high cost-effectiveness via high-throughput and absolute quantification of molecular measures.2 Does the current status of neurochemical profiling by in vivo1H-MRS meet the criteria for molecular epidemiological studies? The answer is NO. However, 1H-MRS may have the potential to serve as a reliable method for neurochemical profiling in clinical diagnostics as well as for metabolic phenotyping in epidemiologic studies. Our optimism is based on our own experience with 1H-MRS and on literature that has demonstrated the feasibility of advanced, non-invasive neurochemical profiling in animals and humans.21–27 In this review, we will first discuss the methodological requirements for MRS data acquisition, MRS data processing and metabolite quantification that are essential for reliable non-invasive neurochemical profiling. Then we will demonstrate the power of 1H-MRS-based neurochemical profiling by showing some examples of its application in neuroscience. Finally, we will present our vision and propose the necessary steps to establish 1H-MRS as a method suitable for large-scale neurochemical profiling in epidemiological research.
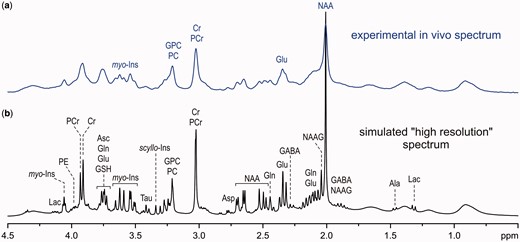
Comparison of an experimental in vivo1H MR spectrum of the brain achievable at 7 T (a) to a simulated ‘high-resolution’ 1H NMR spectrum (b).
Methodology of advanced 1H-MRS
Similarly to 1H NMR spectroscopy of biofluids, high magnetic field strength is also advantageous for in vivo1H-MRS because of increased detection sensitivity and chemical shift dispersion at high fields. However, moving to high magnetic fields is not as straightforward for in vivo applications because wide-bore magnets for human body MRI/MRS are much more complex and costly than the narrow-bore magnets used for 1H NMR spectroscopy of biofluids. In addition, adjustment of the B0 field homogeneity (B0 shimming) and the localization performance of MRS techniques are much more challenging at high fields. Accordingly, localized in vivo1H MRS of the brain can only benefit from high magnetic field when these challenges are successfully resolved. Consequently, in vivo1H-MRS of the human brain is typically limited to 7 T for research applications and only to 3 T in clinical practice. It should be emphasized that the term ‘ultra-high field’ (UHF) is used differently in analytical chemistry and MRI. This term is typically reserved for magnetic fields B0 > 20 T in NMR spectroscopy of liquids, whereas it is commonly used for human body MRI/MRS at 7 T. Even 3T MRI scanners are considered high-field systems in clinical practice.
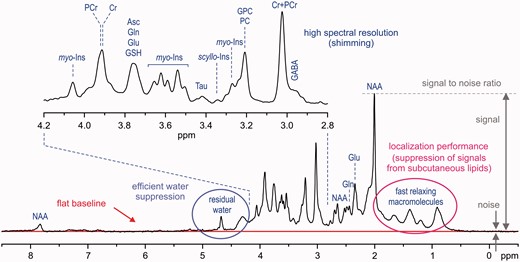
Characteristic factors for in vivo1H-MR spectra quality assessment (STEAM, B0 = 7 T, TE = 6 ms, TR = 5 s, VOI = 8 ml, number of transients (NT) = 160, grey-matter-rich occipital cortex).
Volume selection is a fundamental feature of in vivo1H-MRS data-acquisition techniques, which makes it significantly different from high-resolution 1H NMR spectroscopy of liquids. In theory, the 1H-MR spectrum exclusively originates from the selected VOI without any contamination from the surrounding tissue. These unwanted coherences, especially from subcutaneous lipids (1–2 ppm chemical shift range), can significantly degrade the spectral quality (Figure 2). In addition, volume selection at high fields is challenged by the chemical shift displacement error (CSDE), i.e. spatial displacement of volumes for off-resonance signals from the prescribed VOI (see more detailed explanation in the Supplementary data, available at IJE online). Last, but not least, high spectral quality requires highly efficient water suppression (Figure 2) because the residual water signal may cause major distortions of spectrum baseline and overlap with surrounding metabolite signals. Different localization strategies have been successfully utilized in pulse sequences developed for ultra-high magnetic fields23,25,31–34 in order to improve the localization performance and, consequently, to provide spectra of the best quality. Each of these techniques has its pros and cons, but it appears that the semi-LASER localization sequence33 combined with VAPOR water suppression25,34 is currently the best compromise for operational feasibility and performance. Despite excellent B0 shimming and high-performance localization, the final spectral quality can be severely compromised by frequency and phase fluctuations induced by physiological motion (respiratory and cardiac cycles) during data collection. For these reasons, a single scan averaging mode (where each individual scan is stored separately) is highly advantageous for in vivo applications because it allows for frequency and phase correction of individual scans and elimination of uncorrectable scans before summation. This approach helps to maintain the best achievable spectral quality (Figure 2).
Metabolite quantification
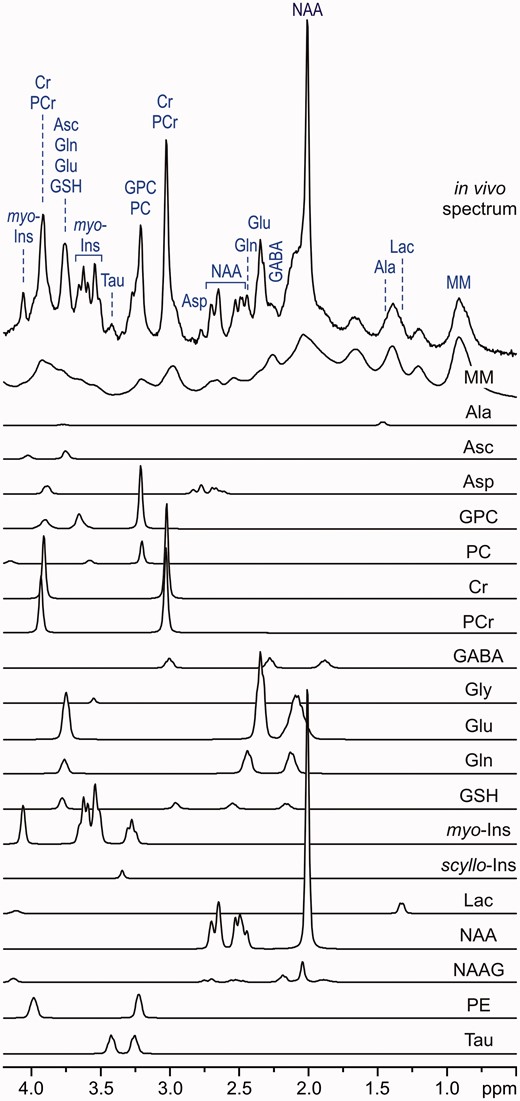
LCModel analysis of an in vivo1H MR spectrum acquired from the human brain at 7 T (STEAM, TE = 6 ms, TR = 5 s, NT = 160, grey-matter-rich occipital cortex). In vivo spectrum can be modelled as a linear combination of brain metabolite spectra from the LCModel basis set: macromolecules (MM), alanine (Ala), ascorbate (Asc), glycerophosphocholine (GPC), phosphocholine (PC), creatine (Cr), phosphocreatine (PCr), γ-aminobutyric acid (GABA), glycine (Gly), glutamate (Glu), glutamine (Gln), glutathione (GSH), myo-inositol (myo-Ins), scyllo-inositol (scyllo-Ins), lactate (Lac), N-acetylaspartate (NAA), N-acetylaspartylglutamate (NAAG), phosphoethanolamine (PE), taurine (Tau). Modified with permission from Tkac et al.25 © 2005 Springer.
In vivo metabolite quantification requires appropriate referencing. The signal of total creatine has been widely used as an internal reference. However, this approach does not fulfil the criteria for ‘absolute’ quantification, because the tCr content differs between brain regions22 and between grey and white matter41, and may change due to neurodegenerative processes.42 Using unsuppressed water signal as a reference appears to be the best available approximation for metabolite quantification because it is robust and only requires the knowledge of the brain tissue water content.
Finally, T1 and T2 relaxation effects have to be taken into account for ‘absolute’ metabolite quantification. Correcting for relaxation effects requires knowledge of T1 and T2, but it is rather difficult to measure them precisely.43,44 In addition, these values vary across different brain regions and with age.43,44 Contrary to metabolite T1 relaxation times, which are nearly independent of the field strength, T2 relaxation times become significantly shorter with increasing B0 field.35 This shortening of T2 values leads to a major loss in signal intensity if long echo-times (TEs) are used at high fields. Moreover, signals of metabolites with spin–spin coupled protons (e.g. glutamate, glutamine, GABA) attenuate at longer TEs because of destructive interferences caused by the J-evolution. Therefore, neurochemical profiling strictly requires localization sequences with short TEs because the substantial part of the neurochemical information available at short TEs is irreversibly lost at long TEs. The ‘absolute’ metabolite quantification can be substantially simplified by acquiring data using an ultra-short TE localization sequence with a long repetition time (TR), when relaxation effects become negligible and can be ignored. The STEAM sequence is the method of choice for ultra-short TE localization, as it allows a reduction of the TE to 6 ms.25,26,36
Advanced 1H-MRS neurochemical profiling at 7 T
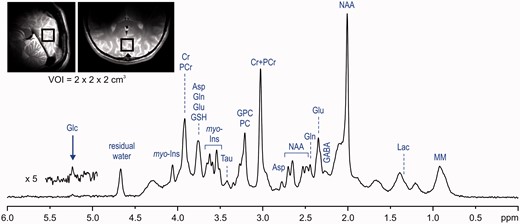
In vivo1H-MR spectrum acquired from the human brain at 7 T (STEAM, TE = 6 ms, TR = 5 s, VOI = 8 ml, NT = 160). Modified with permission from Tkac et al.25 © 2005 Springer.
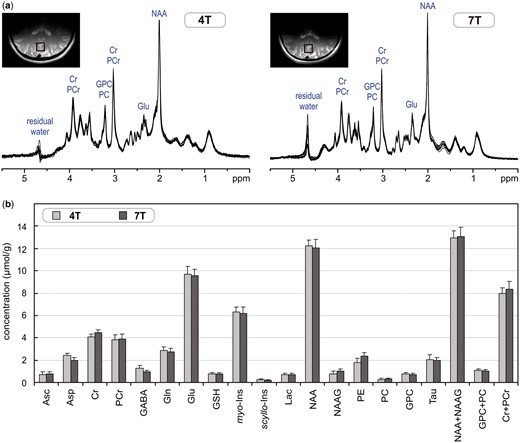
(a) Superposition of in vivo1H-MR spectra acquired from the grey-matter-rich occipital cortex of 10 healthy subjects at 4 T and 7 T (STEAM, VOI = 8 ml, NT = 160, TE = 4 ms at 4 T and TE = 6 ms at 7 T). (b) Comparison of neurochemical profiles determined from these 4T and 7T spectra. Error bars indicate SD. Only concentrations of Asp, GABA, NAAG and PE were statistically different between 4 T and 7 T. Modified with permission from Tkac et al.26 © 2009 John Wiley and Sons.
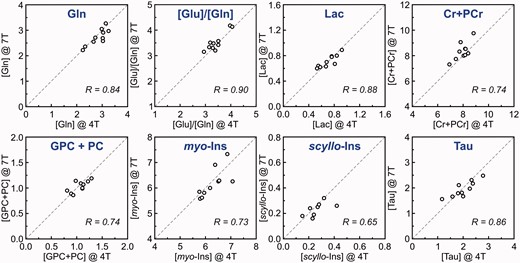
Correlation between metabolite concentrations and concentration ratios of individual subjects determined from 4T and 7T 1H-MR spectra. Concentrations are expressed in µmol/g. Modified with permission from Tkac et al.26 © 2009 John Wiley and Sons.
Similar results were found in a recent multi-centre study that focused on the accuracy and reproducibility of neurochemical profiles in the human brain at 7 T.27 This study was performed at four different institutions (University Duisburg-Essen, University of Minnesota, Leiden University Medical Center and University Medical Center Utrecht) using 7T MRI scanners from two different vendors (Philips or Siemens). The same seven subjects were each examined twice at each site using the same protocol: FASTMAP B0 shimming, semi-LASER localization sequence33 combined with VAPOR water suppression,25,34 LCModel metabolite quantification. 1H-MRS data were acquired from the grey-matter-rich posterior cingulate cortex and the white-matter-rich corona radiata. Concentrations of 10 metabolites were consistently quantified with CRLB < 20%. Neurochemical profiles measured at different sites equipped with MRI scanners from two different vendors were in reasonably good agreement. The test–retest measurements showed a high level of reproducibility and, for several metabolites, such as glutamate (Glu), tCr, tCho and myo-inositol, the primary source of variance was found between subjects. This study clearly demonstrates that harmonization of data acquisition and post-processing of 1H-MRS can produce very similar results at four different 7T MRI sites.
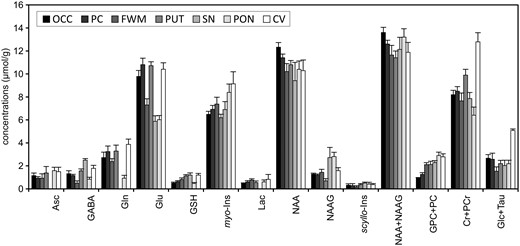
Comparison of neurochemical profiles quantified from different regions in the human brain at 7 T. STEAM, TE = 8, TR = 5 s, N = 5. Error bars indicate SD. Significant regional differences were found for all metabolites except Lac and scyllo-Ins (one‐way analysis of variance with Tukey post hoc, p < 0.005). Brain regions: occipital cortex (OCC), posterior cingulate (PC), frontal white matter (FWM), putamen (PUT), substantia nigra (SN), pons (PON), cerebellar vermis (CV). Modified with permission from Emir et al.22 © 2012 John Wiley and Sons.
The current capabilities of advanced 1H-MRS at 7 T can be nicely demonstrated by studies that aimed to measure neurochemical changes in the activated human brain.45–49 These studies clearly illustrate that the advanced technology and methodology of 1H-MRS currently available has the power to detect metabolite concentration changes as low as 0.2 µmol/g. Visual stimulation studies45–48 show very consistent results of small, but significant, changes in four metabolites (Lac, Glu, glucose, aspartate) that are directly linked to energy metabolism. Techniques used in these studies provide neurochemical profiles with up to 19 brain metabolites and enable quantification of their changes during stimulation paradigm with precision better than 0.1 µmol/g.45,46,48
Feasibility of 1H-MRS neurochemical profiling at 3 T
Although 1.5 T is the most common field strength for clinical MRI (approximately 15 000 units already installed and more than 50% of 2500 new units sold worldwide), the sensitivity and spectral resolution at this field are not sufficient for a meaningful neurochemical profiling (i.e. reliable quantification of metabolites beyond NAA, tCr and tCh). An ultra-high magnetic field is better-suited for non-invasive neurochemical profiling, but widespread availability of 7T MRI scanners for large-scale cohort studies is not realistic in the near future. For that reason, 3T MRI scanners, which are increasingly available on clinical sites, seem to be a feasible platform for neurochemical profiling. Although slow implementation of newly developed 1H-MRS techniques on clinical MRI scanners has created a widening gap between what is feasible at specialized MR research centres and what is currently available for routine clinical practice, advanced 1H-MRS methodology developed for 7 T can be implemented on 3T MRI scanners without any requirement on hardware upgrades. It was already successfully demonstrated that simply upgrading the pulse sequence (software), which consisted of FASTMAP shimming29,30 and semi-LASER localization33 with VAPOR water suppression,25,34 significantly improved the 1H-MRS data quality and increased the range of reliably quantified metabolites from the original 3–5 (using vendor-provided sequences) up to 13.21 In addition, the same methodology was implemented at two different institutions (the University of Minnesota, in Minneapolis, and the Institut du Cerveau et de la Moelle, in Paris) and the measured neurochemical profiles (vermis, ponds) were nearly identical between these sites. Moreover, this approach showed the feasibility to detect inter-individual differences in the healthy brain.21
A similar approach was used to investigate the feasibility and reproducibility of neurochemical profiling in the human hippocampus at 3 T.43,50 The hippocampus is a brain region of high clinical interest because its dysfunction is associated with several neurological and neuropsychiatric disorders such as Alzheimer’s disease, epilepsy, schizophrenia and depression. However, 1H-MRS of the hippocampus is challenging due to its size and shape and the severe B0 inhomogeneity in that brain region. Using a semi-LASER localization sequence and FASTMAP shimming routinely provided 1H-MR spectra of high quality from a relatively small VOI of ∼4 ml.50 Achieved spectral quality allowed reliable quantification of up to 12 brain metabolites. This study clearly demonstrates that neurochemical profiling of the hippocampus is feasible at 3 T despite technical challenges. For most metabolites, the between-session variation was lower than between-subject variation, indicating that the method has the sensitivity to detect inter-individual differences in the healthy brain. Our preliminary 1H-MRS results from the occipital cortex demonstrate that it is even possible to increase the number of quantifiable metabolites at 3 T close to the range achievable at 7 T, but it requires exceptional spectral quality (see Supplementary Figures 1 and 2, available as Supplementary data at IJE online).
Applications of 1H-MRS for CNS disorders
In vivo1H-MRS has been widely applied to investigate CNS disorders. A PubMed search for keywords ‘MR spectroscopy human CNS disorders’ retrieved over 6500 original papers and 1500 reviews. These MRS studies report valuable observations about a variety of CNS disorders, but the range of detectable metabolites is almost completely limited only to NAA, tCr and tCho. Some recent publications of interest include reviews on Alzheimer disease and mild cognitive impairments,51,52 common dementias,53 psychiatric disorders,54 autism spectrum disorders55 and alcohol abuse disorders.56 Recently, the MRS Consensus Group published useful recommendations for clinical 1H-MRS in CNS disorders.57 However, there are few published studies utilizing the true potential of 1H-MRS-based neurochemical profiling to investigate metabolic changes associated with the brain disorders. For example, in vivo neurochemical profiling was used to study biochemical changes in patients with spinocerebellar ataxias,58–61 type 1 diabetes62 and adrenoleukodystrophy.63
Potential of in vivo neurochemical profiling in epidemiology
As stated in the previous section of this paper, non-invasive neurochemical profiling is, in principle, feasible on 3T MRI scanners that are commonly available in hospitals. However, successful neurochemical profiling by 1H-MRS requires the implementation of efficient B0 shimming methods (e.g. FASTMAP) and high-performance localization techniques (e.g. semi-LASER, VAPOR water suppression). In addition, preprocessing software and appropriate metabolite quantification technique (e.g. LCModel), with a database of well-constructed prior knowledge, are also required. The main problem for wider use of 1H-MRS for screening purposes is the duration of the scanning session and consequently the cost of this examination. The duration of a typical 1H-MRS scanning session, including MRI for positioning of the VOI, might be as long as 60 min, which is far too long for screening. Using a fully automated approach, it should be possible to reduce the time period necessary for parameter optimization (B0 shimming, power adjustment, water suppression) from about 10 min to 2 min or less. With 5 min of 1H-MRS data acquisition and an additional 3 min for structural MRI, reduction of the scanning time below 10 min seems to be feasible. Such an approach would significantly increase the throughput of the method and thereby reduce the cost of examination. Although higher throughput for 1H-MRS-based screening is desirable, any improvements in the throughput cannot come at the expense of the overall spectral quality.
As neurochemical profiles show significant regional differences (Figure 7), placement of the VOI plays an important role in data reproducibility. For this reason, automatic VOI positioning methods have been developed for 1H-MRS.64 These regional differences in metabolite concentrations further complicate 1H-MRS by making it challenging to choose the most appropriate brain region for neurochemical profiling. From this viewpoint, comprehensive neurochemical profiling of multiple brain regions would be preferential but would substantially decrease the throughput. Thus, it appears that MR spectroscopic imaging (MRSI), a non-invasive technique that provides information about the spatial distribution of metabolites, might be the method of choice for a potential non-invasive neurochemical profiling. However, even for the most advanced MRSI techniques currently available,65,66 the range of quantifiable metabolites and the precision of their quantification are behind the capabilities of single voxel MRS techniques.
Finally, recently published 1H-MRS trials clearly demonstrated that it is feasible to obtain highly reproducible data at different sites (in the USA and Europe) using MRI scanners from different vendors.27 This was possible by implementing the same MRS methodology including data acquisition and processing (FASTMAP shimming, semi-LASER localization sequence, VAPOR water suppression, LCModel processing). There is an ongoing multi-centre effort (NIH grant: Partnership for MRS biomarker development, PI: Gülin Öz, University of Minnesota) that seeks to simplify the operator input necessary to acquire MRS data, to make it robust and user-friendly and to make it available for all major clinical MR platforms. This effort will enhance the possibility to make high-quality neurochemical profiling widely available on 3T clinical MRI scanners, which will increase the probability for successful in vivo large-scale cohort screening in the near future.
In conclusion, in vivo neurochemical profiling in the human brain is feasible, but the widespread use requires the implementation of the most advanced methodology of 1H-MRS, including B0 shimming, localization pulse sequences, data processing and metabolite quantification. In addition, these techniques have to be broadly available on 3T MRI scanners from major MR systems vendors (Siemens, Philips and GE). Easy access to in vivo neurochemical profiling for the general population is probably not feasible in the near future, but this screening technique should be made available as soon as possible for disease prevention, at least for at-risk sub-populations.
Supplementary Data
Supplementary data are available at IJE online.
Acknowledgements
This work was supported by grants of the National Institutes of Health to the Center for Magnetic Resonance Research (P41 EB015894 and P30 NS076408).
Conflict of interest: None declared.

